Method details in appendix.
Flesh-Kincaid grade-level test
We can use the Flesh-Kincaid test to quantify the US grade level of posts and comments from these newsletters.
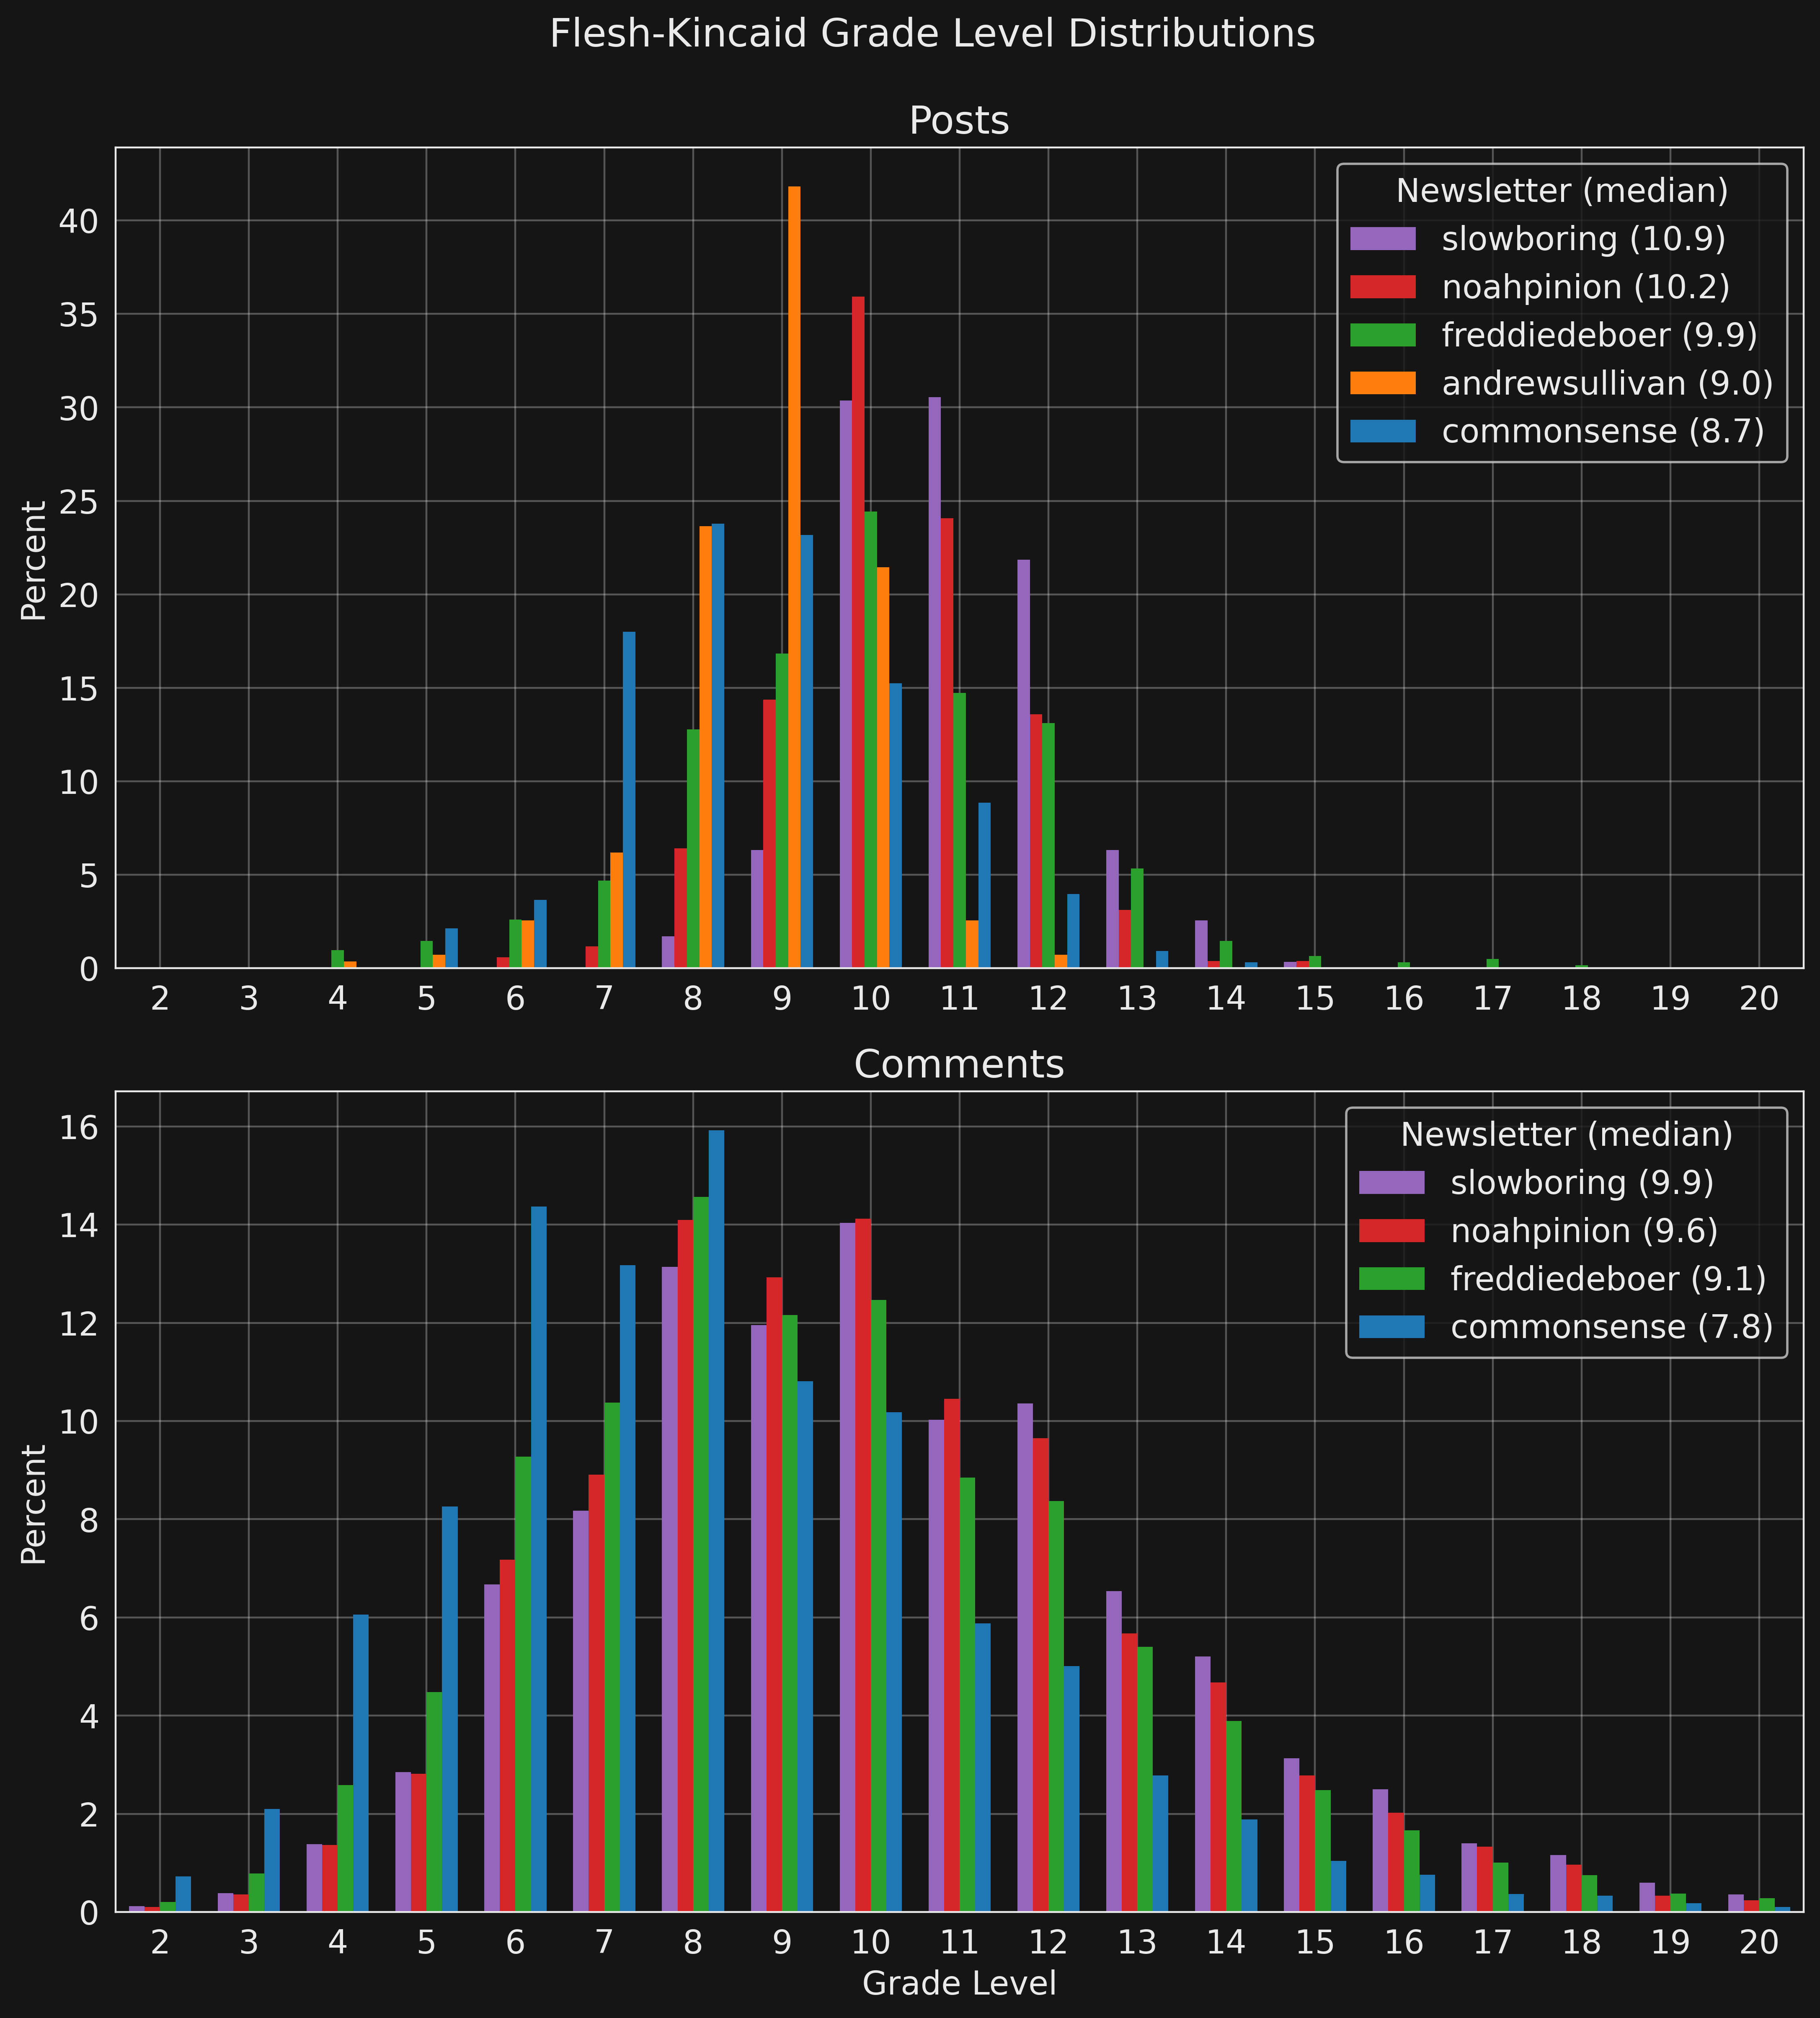
It is interesting to see that posts and comments for one newsletter have comparable grade levels.
The distributional stats for the posts are as follows.
| Newsletter | Posts | Mean | Std | Min | 10% | 25% | 50% | 75% | 90% | Max |
|---|---|---|---|---|---|---|---|---|---|---|
| slowboring | 582 | 11 | 1.2 | 7.6 | 9.6 | 10.2 | 10.8 | 11.7 | 12.5 | 15.3 |
| noahpinion | 515 | 10.3 | 1.3 | 5.5 | 8.8 | 9.5 | 10.2 | 11.1 | 11.9 | 15.1 |
| freddiedeboer | 618 | 9.9 | 2 | 3.8 | 7.6 | 8.7 | 9.9 | 11.2 | 12.3 | 17.8 |
| andrewsullivan | 275 | 8.8 | 1 | 4.5 | 7.6 | 8.4 | 9 | 9.4 | 10 | 11.7 |
| commonsense | 328 | 8.7 | 1.6 | 5.1 | 6.8 | 7.5 | 8.7 | 9.8 | 10.8 | 13.5 |
And for comments
| Newsletter | Comments | Mean | Std | Min | 10% | 25% | 50% | 75% | 90% | Max |
|---|---|---|---|---|---|---|---|---|---|---|
| slowboring | 71,471 | 10.1 | 3.1 | 0.7 | 6.4 | 8 | 9.9 | 12.1 | 14.3 | 20 |
| noahpinion | 14,072 | 9.9 | 3 | -0.3 | 6.3 | 7.8 | 9.6 | 11.7 | 13.9 | 20 |
| freddiedeboer | 29,607 | 9.4 | 3.1 | 0.5 | 5.7 | 7.2 | 9.1 | 11.4 | 13.6 | 20 |
| commonsense | 59,203 | 8.1 | 2.9 | -0.3 | 4.7 | 6.1 | 7.8 | 9.8 | 11.9 | 20 |
You can find examples of my comments and their FK scores in the appendix to calibrate your perception of these grade levels.
Note that comments with a FK test value greater than 20 are excluded from this analysis as they generally correspond to improperly formatted text. E.g., a bulleted list where each entry is not terminated with a period and thereby the entire list is treated as single sentence.
Comments per a post
We can also analyze the volume of comments on posts in each newsletter. The following figure shows the distribution of comments-per-a-post for each newsletter.
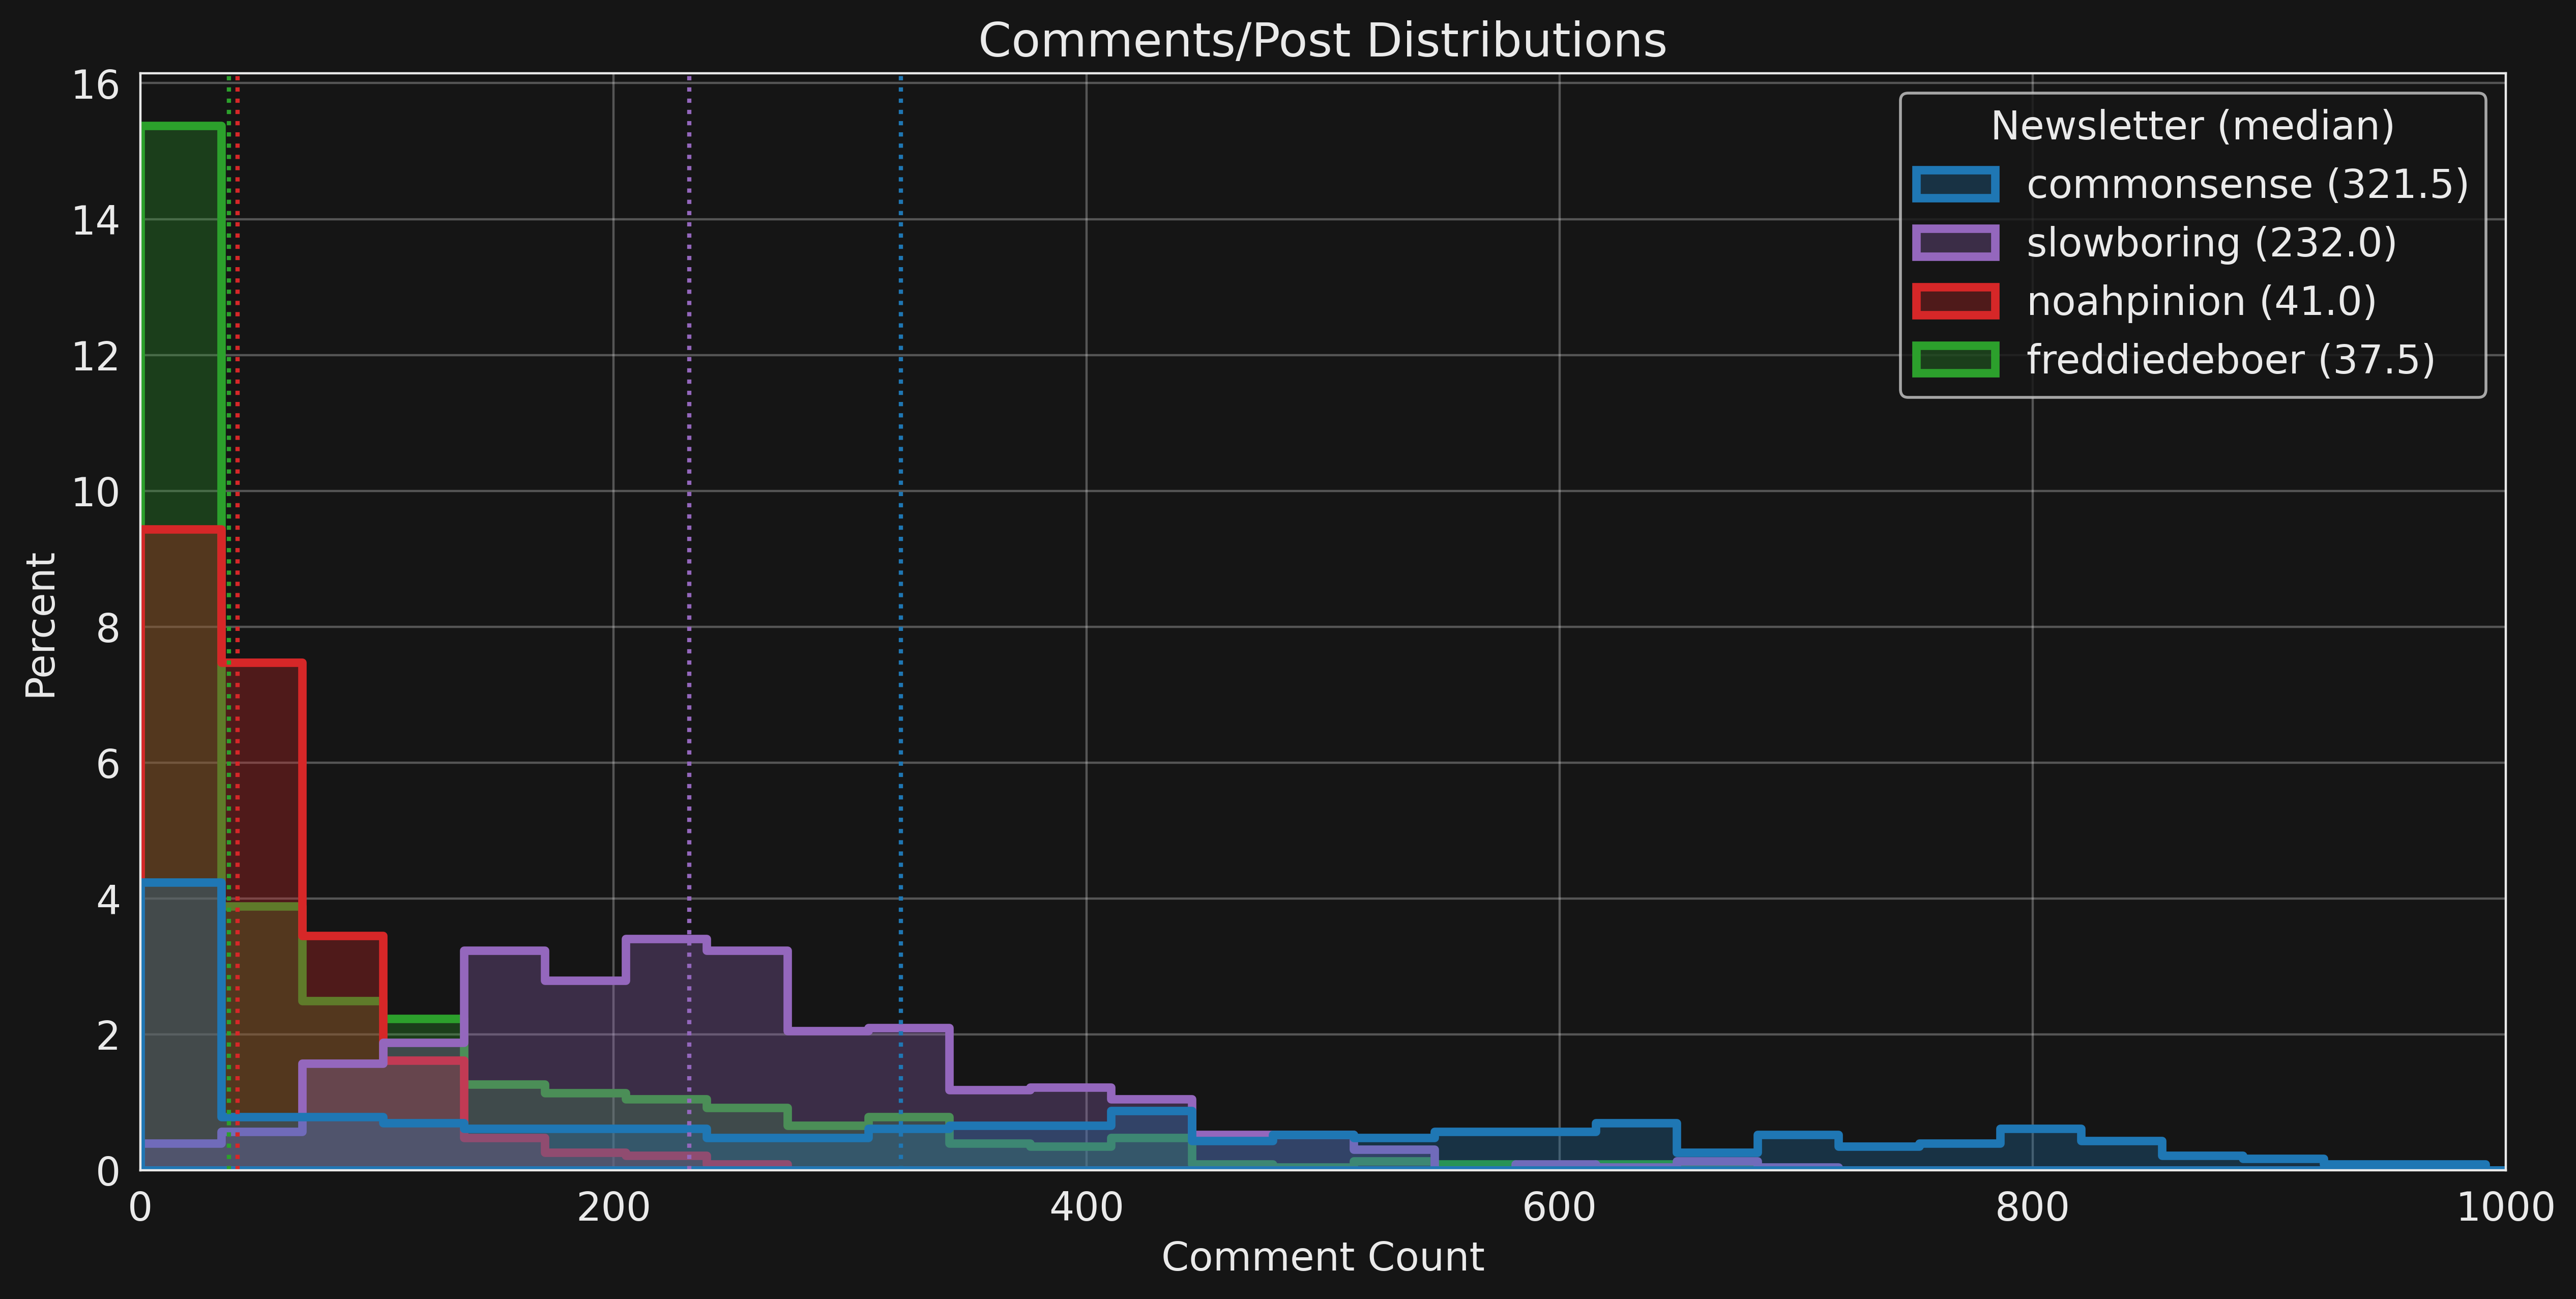
Note that the x-axis is cutoff at 1000 comments/post because there are a few outlier posts with an exceptionally large number of comments is indicated in the following table of distribution stats.
| Newsletter | Posts | Mean | Std | Min | 10% | 25% | 50% | 75% | 90% | Max |
|---|---|---|---|---|---|---|---|---|---|---|
| commonsense | 436 | 355.8 | 312.2 | 0 | 0 | 56.5 | 321.5 | 584.8 | 798 | 1641 |
| slowboring | 600 | 247.7 | 123.7 | 2 | 107 | 160 | 231.5 | 316.2 | 413.3 | 1034 |
| noahpinion | 527 | 54.2 | 42.3 | 0 | 16 | 26 | 41 | 72.5 | 106 | 268 |
| freddiedeboer | 722 | 91 | 123.4 | 0 | 0 | 0 | 37.5 | 129.8 | 274.8 | 663 |
Comment volume over time
Are subscribers commenting more or less over time? To answer that question, the following figure plots the number of comments for each post by date.
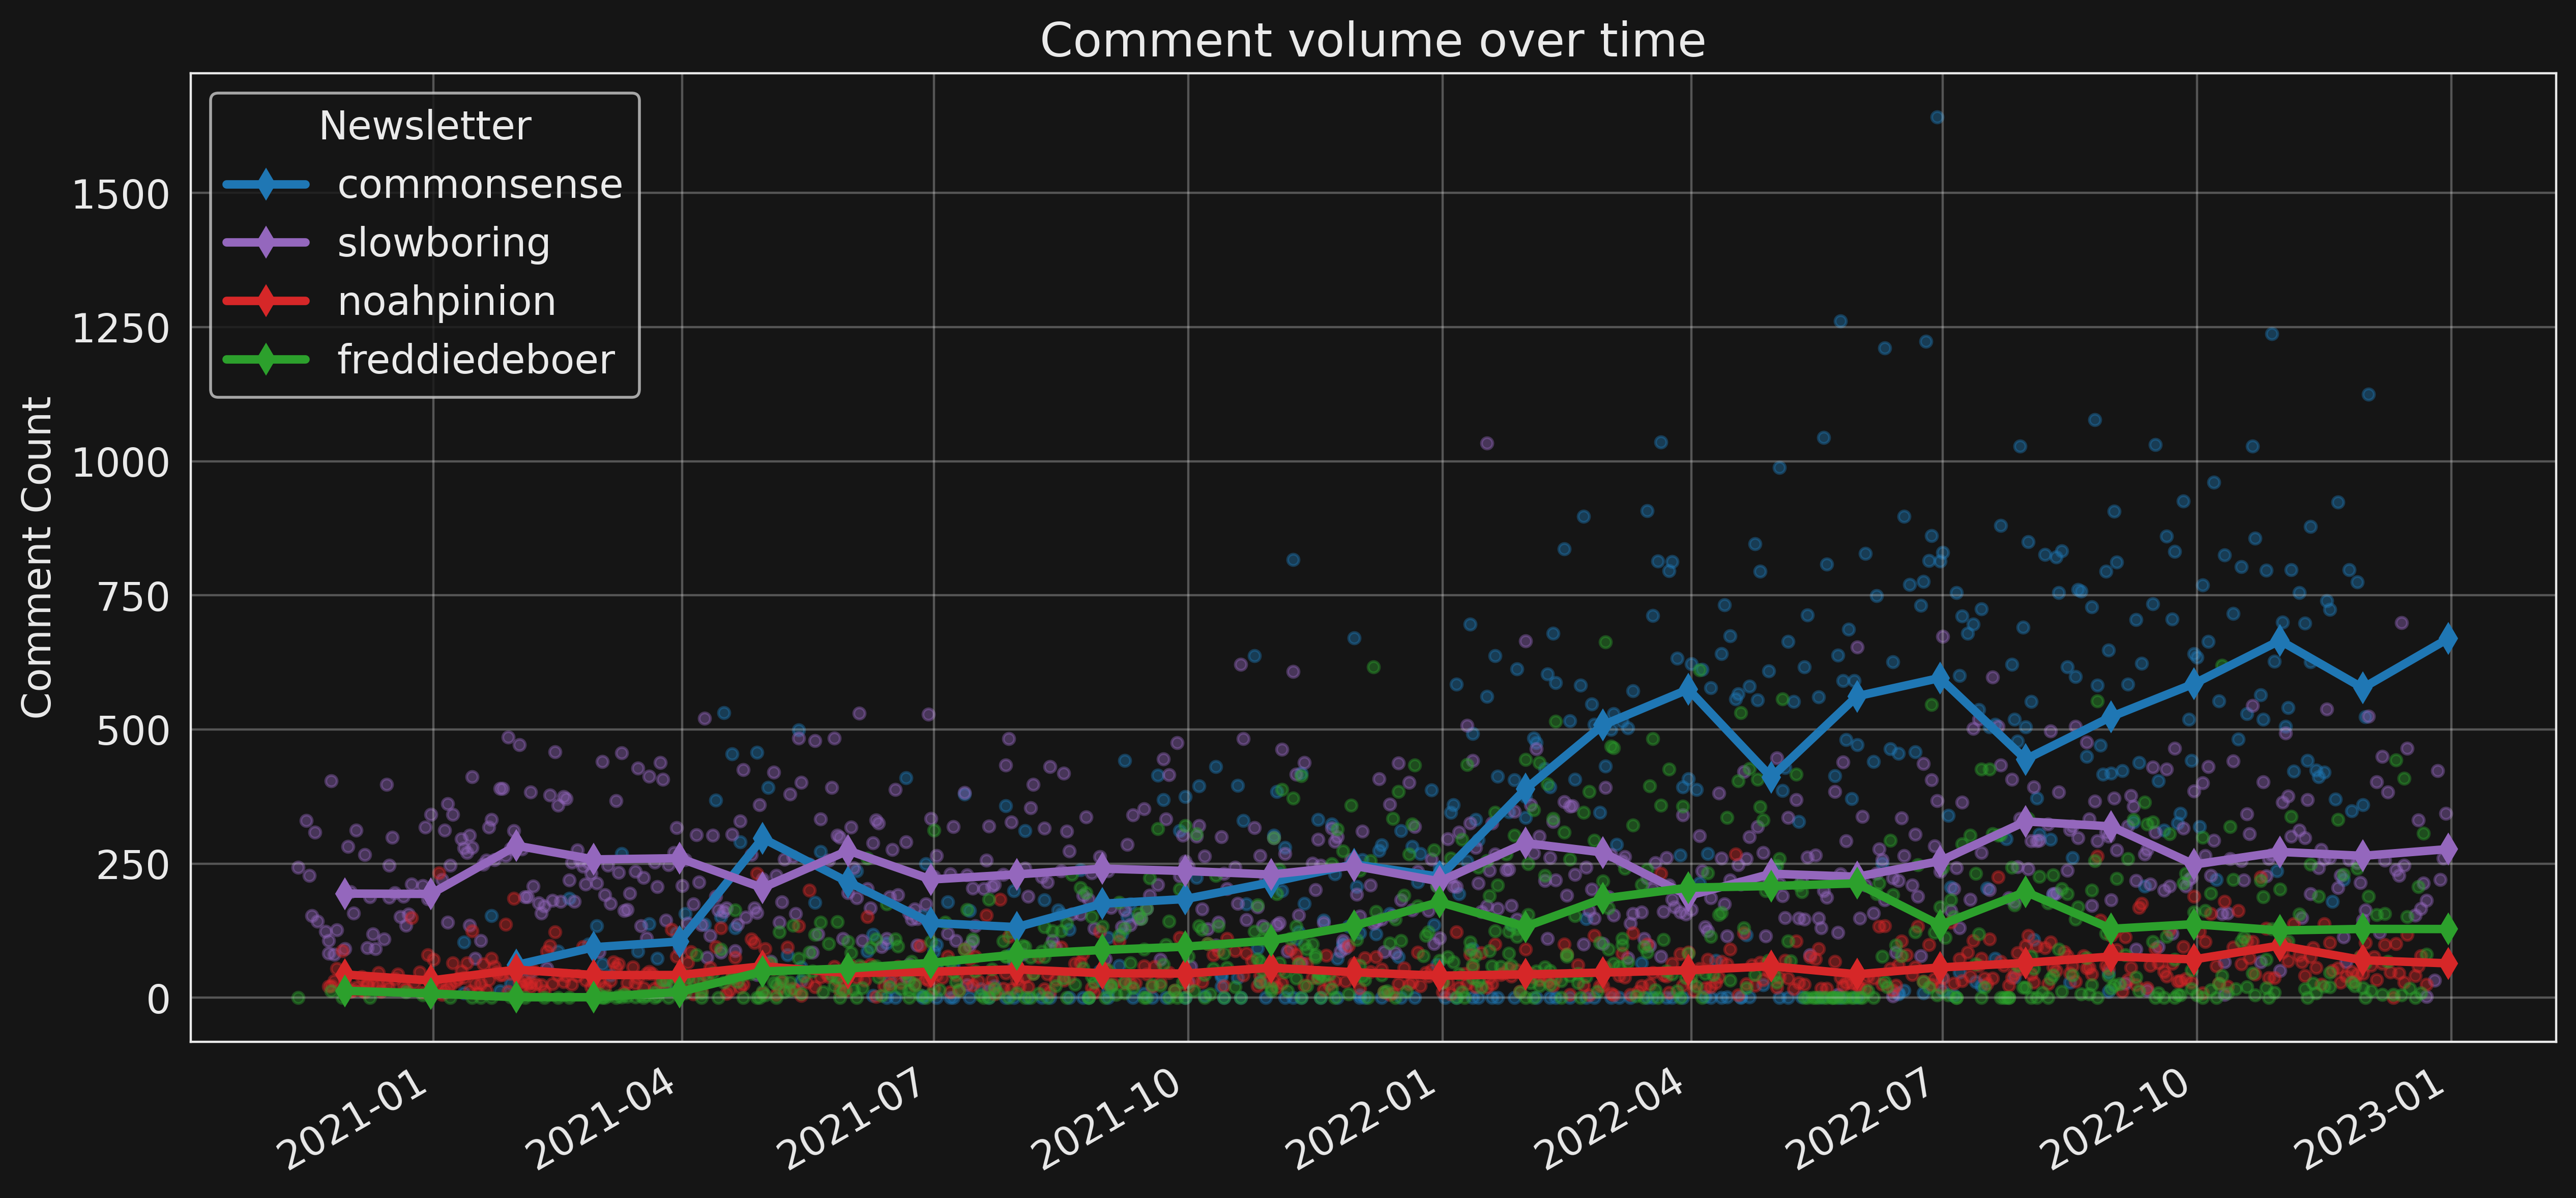
Points correspond to individual posts and lines show the monthly average of comments/post. In computing that average, posts with zero comments are excluded because some authors disable comments for some of their posts.
Key terms
What makes subscribers like some comments more than others? Can we identify key terms that boost (or hinder) the number of likes? As a naive attempt to quantify that, a linear regression model is constructed relating term frequency in a comment to number of likes for that comment. The coefficient for each term quantifies its average contribution to likability.
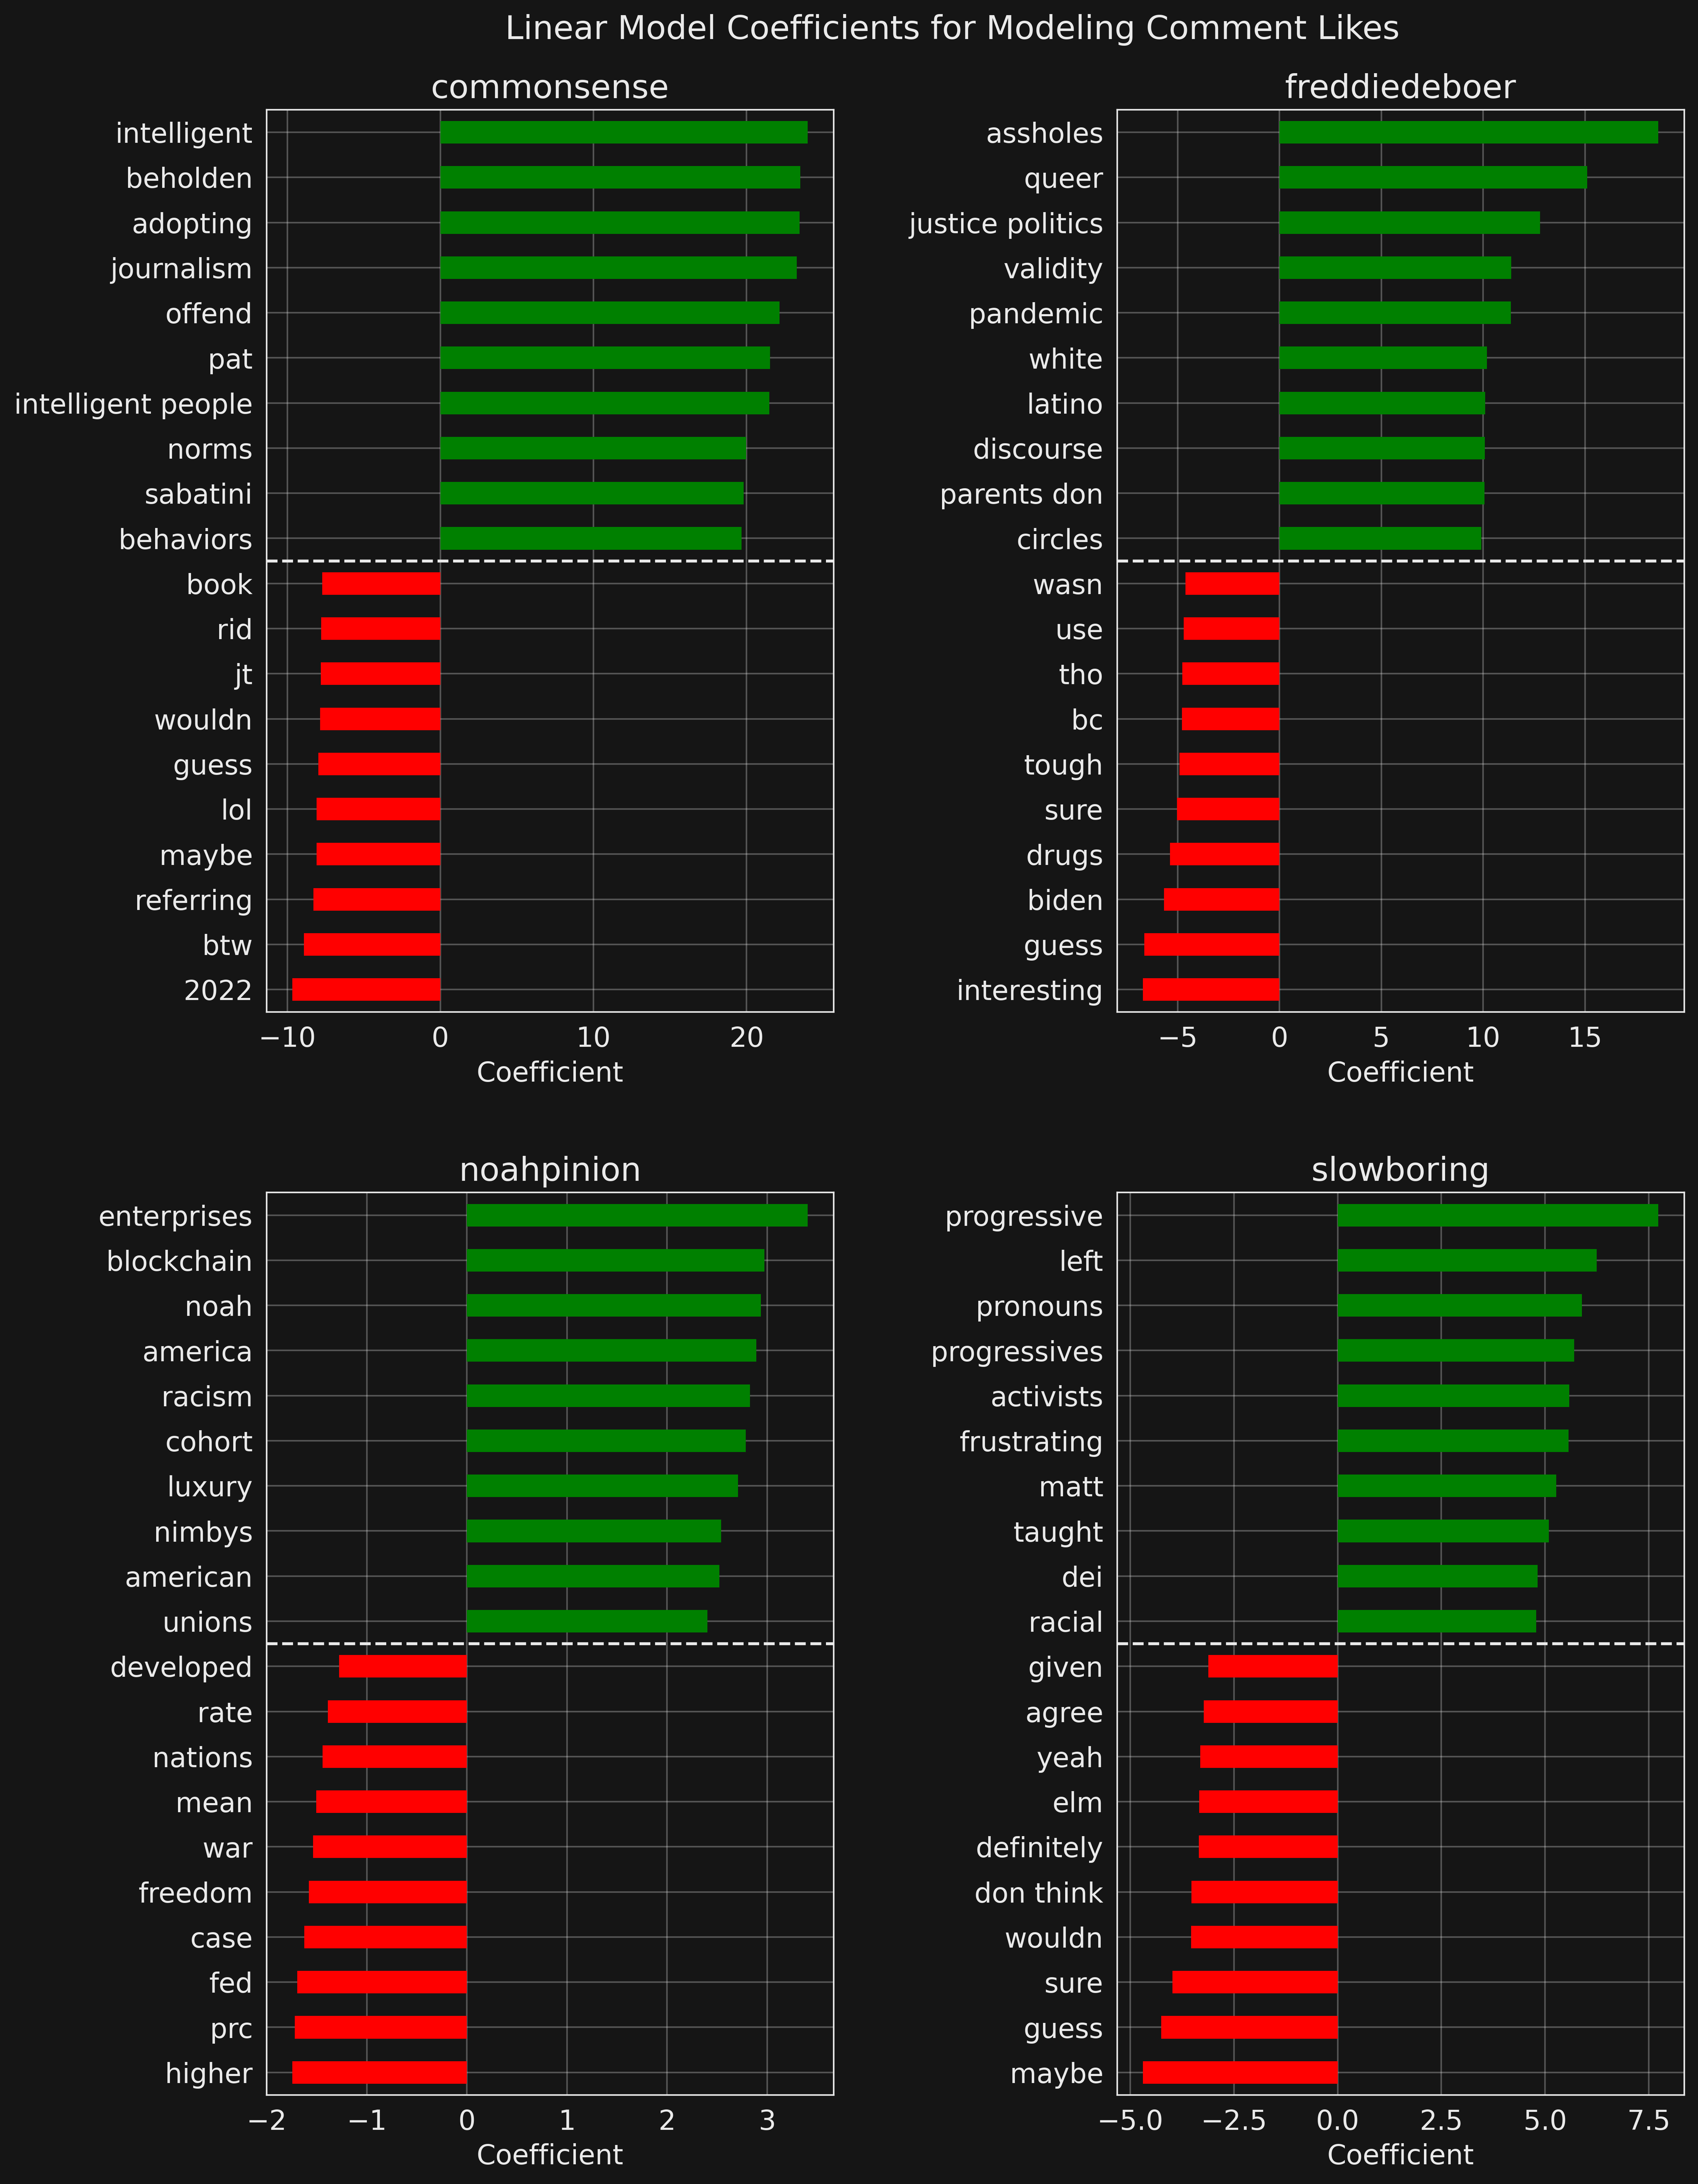
For each site, we compute the term count of all comments that are at least 50 words long and retain the top 10,000 most-frequent terms. Term counts are re-weighting using term frequency–inverse document frequency to better represent how important a term is to a comment. The tfidf scores are then normalized so that each term has a variance of one across all comments. Finally, comment likes are regressed against normalized tfidf scores using a linear model fit through stochastic gradient descent.
For details on this type of text transformation see the Jupyter notebook from the Slow Boring Article Clusters project.
Appendix
Methods
Posts and comments are fetched using substack_client as described in, Developing a Substack client to fetch posts and comments. The Flesh-Kincaid grade-level test is calculated using the textstat library. You can view the analysis in the Jupyter notebook analysis.ipynb.
Data
A simple Python script extracts relevant public metadata about posts and comments. That is then augmented with the text-aggregation metrics of FK score and word count. Data files on github.
posts.csv
Each record corresponds to one post and the columns are as follows.
site- Name of the newsletterdate- Date postedword_count- Length of the post in wordsgrade_level- Flesh-Kincaid grade levelcomment_count- Number of comments on postlikes- Number of likes on post
comments.csv
Each record corresponds to one comment and the columns are as follows.
site- Abbreviated name of the newsletterword_count- Length of the article in wordsgrade_level- Flesh-Kincaid grade levellikes- Number of likes on comment
term_coeffs.csv
The 50 largest and 50 smallest coefficients for a linear model of term frequency to number of likes on a comment.
site- Name of the newsletterterm- Word or bigramcoeff- The coefficient for this term in a linear model
Example comment FK scores
Here are a few examples of my comments and their Flesh-Kincaid test values. You can find all my comments and their FK grade levels in a searchable interface at matthagy.github.io/substack_comments.
KF = 19.7
I find this relevant context for understanding why, as the article says, “it would be inappropriate for the Fed to declare victory on inflation”, and why the Fed is not indicating that, “ it is time to start taking a more measured approach and see how the data evolves.” It is important to know that even the inflation doves—including doves that set monetary policy—believe we need a softening in the labor market to get inflation under control and thereby project restrictive monetary policy throughout 2023.
KF = 12
Great article! It is yet another solid analysis and argument for courting swing voters. The 2022 election data provides exceptionally strong evidence against mobilization theory.
Yet it won’t convince the proponents of this theory to abandon it in favor of courting swing voters. This is because they didn’t calculate their way into mobilization theory based on any polling/voting data but instead adopted it as a post hoc justification for why they needn’t abandon their most unpopular policies and messaging. We simply can’t reason people out of ideas that they didn’t reason themselves into in the first place.
KF = 8.1
I agree that there may be a distinction. I haven’t read them recently and therefore won’t make a judgment call there. I’m just pointing out that they appear to be generating a lot of rightwing content and catering to a rightwing audience, hence they certainly appear rightwing to those of us who aren’t reading them.
KF = 2.9
“The case for NGDP targeting”, https://www.slowboring.com/p/the-case-for-ngdp-targeting